Getting our 💩 together — literally
How we developed a load balancer for our company's toilets to recommend the cleanest loo to our colleagues.


How we built a load balancer for our company’s toilets
At Q42 we love tech, especially when we can apply it to silly things that eventually turn out to be useful. In our former office we had connected toilets, where locking a door triggered a Philips Hue bulb, indicating which toilet was occupied. This was especially handy, because the toilets were quite far apart from each other.
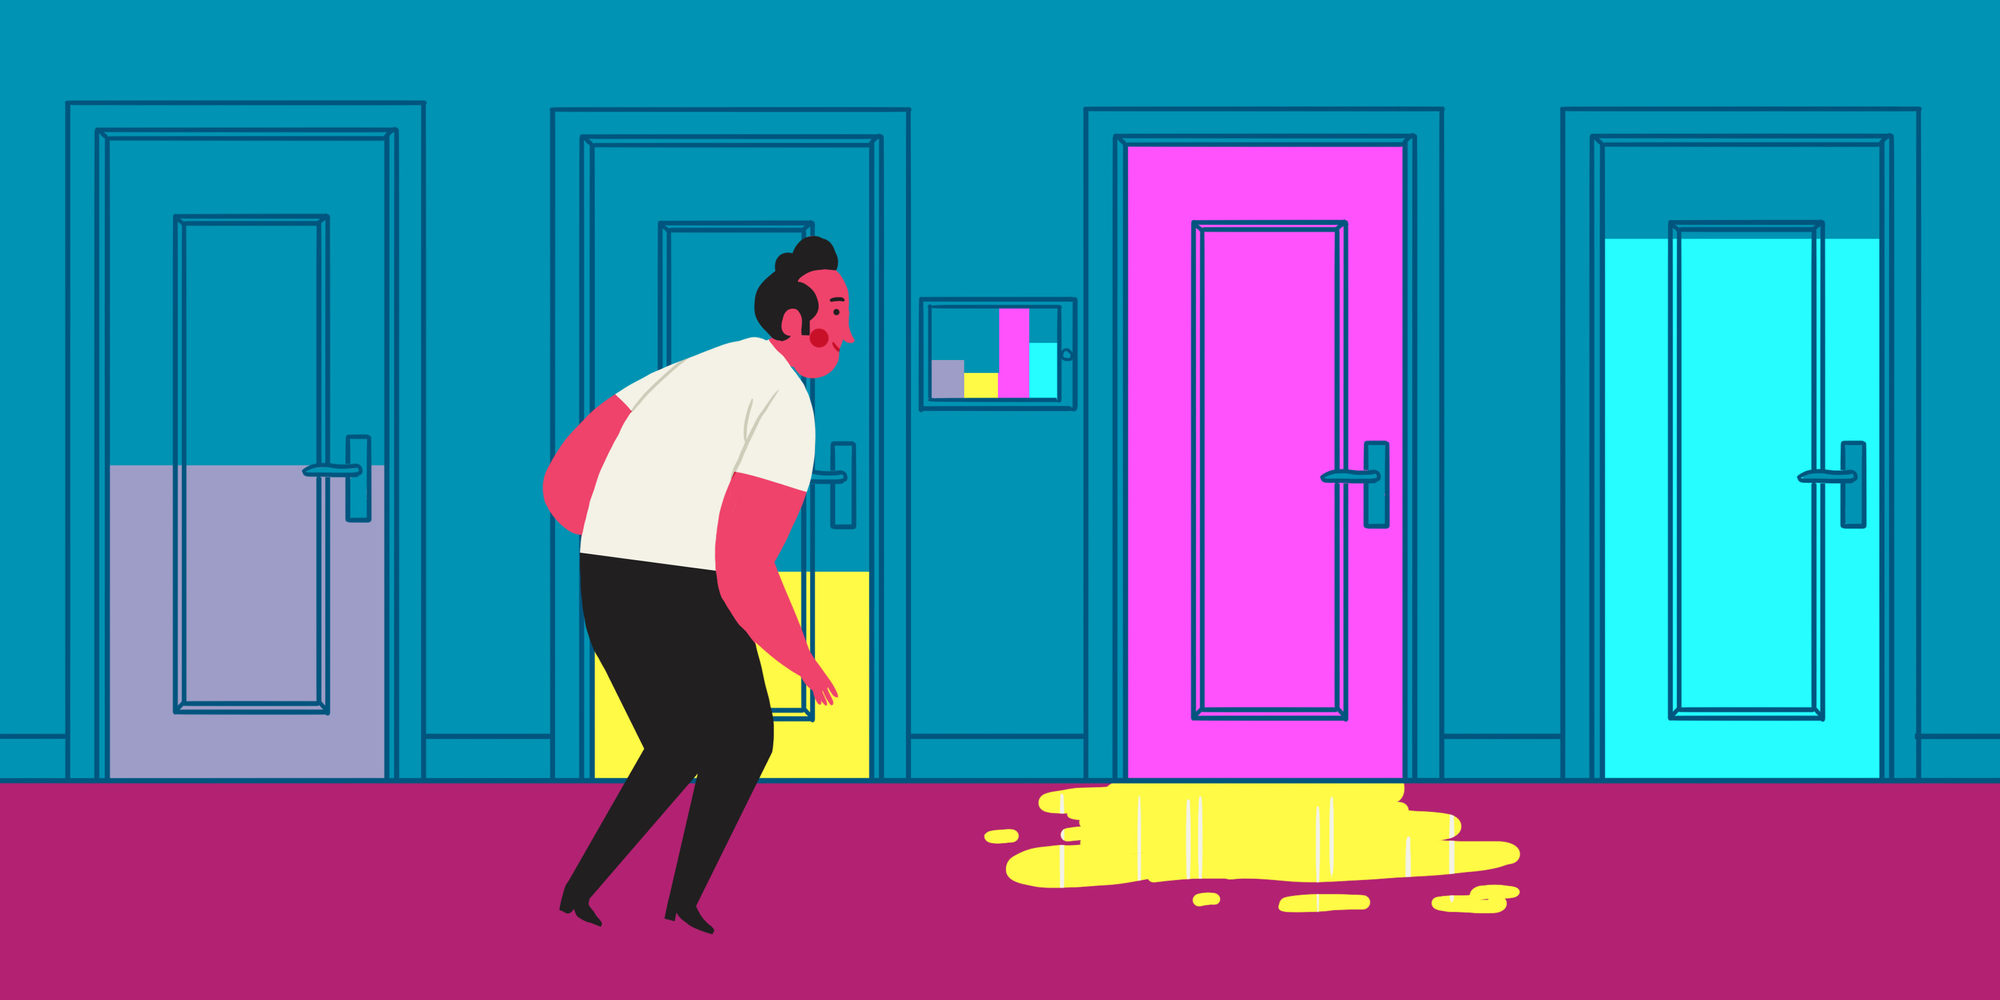
When we moved to our new offices in The Hague last year, we definitely wanted to reinstate this great feature. However, our new office space has four adjacent toilets. So you can see at a glance which one is free. Therefore, we thought we would tackle another big challenge: choosing the cleanest bathroom, so you can spend your 15 minutes of Instagram scrolling in healthy comfort. Without the risk of smelling your coworkers’ previous visits.
We knew what we had to do! During our annual two-day hackathon w00tcamp we developed a system that measures how a loo is used. With this information we could make sure that all toilets are used equally, so that everyone enjoys the cleanest bathroom possible. Just like our trusty load balancers do with all our web traffic. We appropriately named it ‘Shitty Load Balancer’.
Harvesting your precious data 😈
So we wanted to measure the difference between big and small potty visits. How? Create a computer nose that checks the amount of smell? A camera in the bowl?
After some careful thought, we decided that filming our colleagues’ behinds wasn’t such a great idea, and measuring air quality was a lot more difficult than we thought. Since we only had two days to complete the project, we needed something simple, non-intrusive, and reliable. So we came up with an easy idea: a sensor in the lock that detects how long a toilet is in use. With that single piece of data we could figure out if a toilet is occupied at a certain time, as well as the duration of the visit.
Based on this session length we would guess what the potty visitor actually did. Anything less than three minutes would probably be a pee and anything longer than that would be a poo. We came to this number by doing some ‘field-research’, timing and questioning toilet visitors. We know, this is not terribly accurate. There will be some false positives, with people just sitting there playing Clash Royale or Fortnite, but for us it’s accurate enough.
We also wanted a wall screen that shows the state of all four toilets at a single glance, with a recommendation which loo to choose. Besides, we had the stretch goal to create an open API, maybe for a Slackbot that you could ask which toilets are available without leaving your desk. Also, other w00tcamp teams might want to use our data in the future. So we somehow had to get the sensor data onto the interwebs. This wasn’t a particular challenge: a simple Raspberry Pi or Arduino would suffice. We settled with a Raspberry Pi ZeroW, because it has built-in Wi-Fi and we had enough experience with its setup from previous hackathons at Q42. The Pi only has one job: to send an HTTP request to Firebase every time someone enters or leaves a toilet.
Crunching the numbers
Now that all this data was gathered by our sensors and Pi, we could actually load-balance the shit (pun intended) out of this thing!
We chose Google Cloud Functions as our backend, combined with the Cloud Firestore to save all the toilet visits. Not only because we wanted to provide a public API, but also because this gave us a nice loosely coupled architecture. When someone enters a toilet, we create a time-stamped document in the collection associated with that toilet ID (C, M, Y or K in our case). When someone leaves a toilet, we add an end-timestamp and also what ‘type’ of visit we think it was:
const type = sessionLength > 3 ? '💩' : '💦';
As you probably know, it’s no problem to use Emoji’s in JavaScript. But this is the only justifiable case we ever came across to actually do this. 😃
Every loo visit triggers the update of a separate document in the store which calculates the state of the toilet, whether it’s occupied or not, the total number of sessions and the session type.
switch (type) {
  case '💦': nrOfPees++; break;
  case '💩': nrOfPoos++; break;
}
So how do we decide which loo is the best to visit? We didn’t do any fancy machine learning with neural networks. And, frankly, you don’t really need to. Nothing wrong with a good ol’ ranking algorithm. We decided to assign penalty points for each toilet and recommend the one that a) is available and b) has the lowest score. We came up with three metrics:
- Number of sessions since last cleaned (every morning the score is reset manually by the cleaner).
- Has had a session in the last 5 minutes.
- Marked as dirty by a user.
Both 1. and 3. are ways to help the algorithm manually, the former by the cleaner and the latter by a user — someone who found out the hard way… Below we’ll explain more specifically how this works.
We give points for each metric:
- 1 point per session (the more a toilet is used, the more likely it is to be left dirty).
- 5 points for each recent session (there might still be a smell).
- 30 points for a toilet marked as smelly, decaying within 30 minutes (so every minute 1 point is deducted).
Tally up the points and pick the available toilet with the lowest score and you have yourself a winner!
This little algorithm was all just based on guesswork and our shared knowledge of using toilets. But in practice it turns out to work pretty well — more on that below.
Now we only needed a fancy dashboard to show the state of the toilets and present our recommendation to toilet goers. For this we created a simple Vue.js app that reactively binds to our Firestore dataset, eliminating the need to also build our own API.
We had a few design iterations but eventually went with something that visually connected with the actual toilets. We really wanted people to be able to see the state and recommendation at a glance while walking towards the toilets. Nobody wants to stop and look at a complicated UI before deciding on what toilet to enter. It had to be simple and fast.
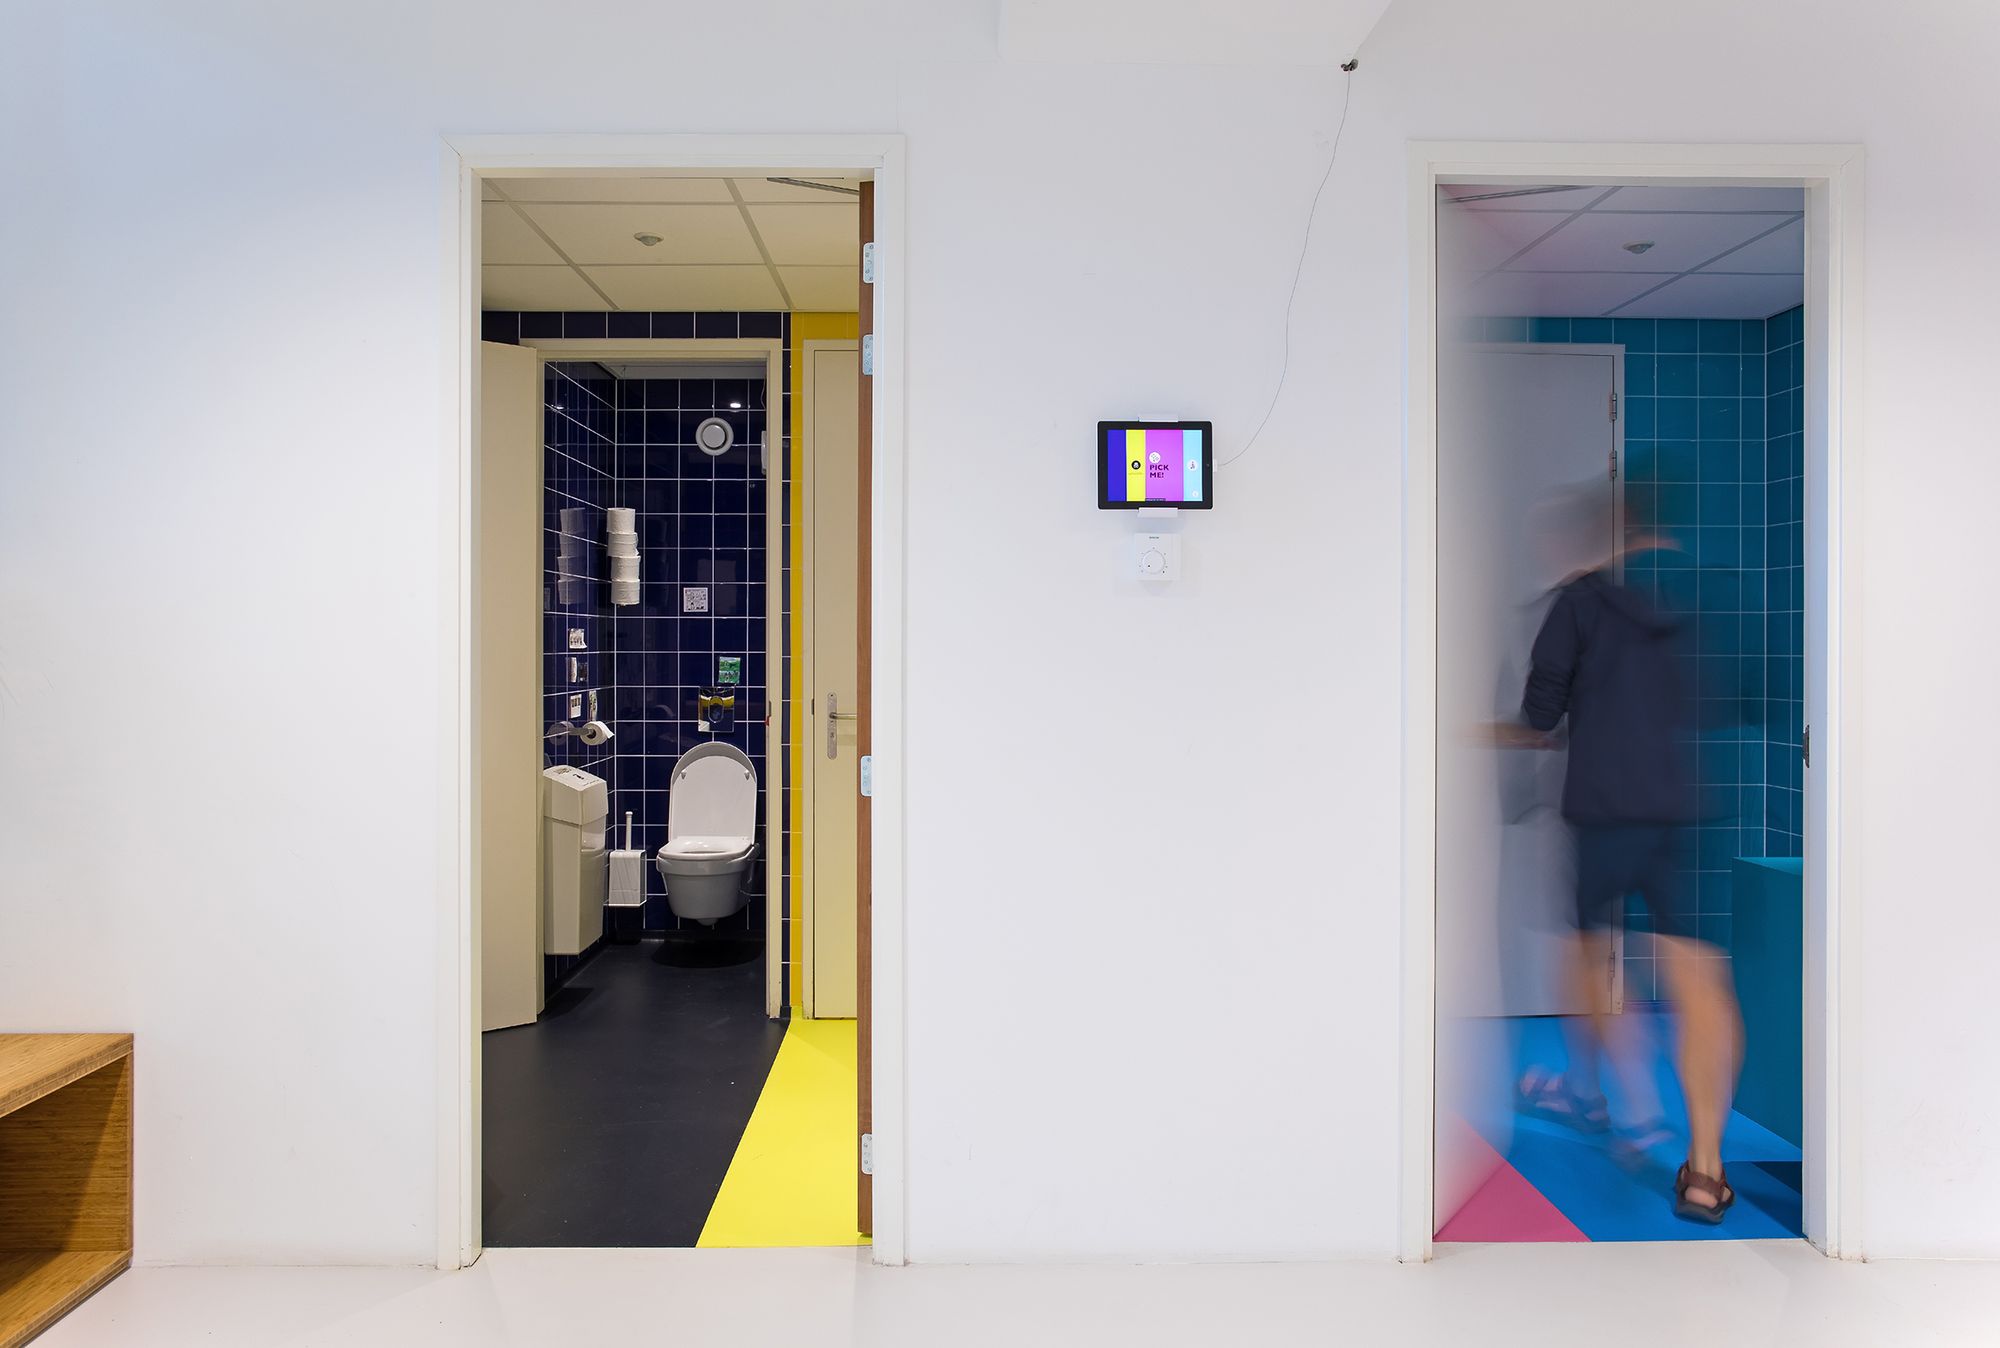
We placed a tablet on the wall next to the toilet doors. Resembling the CMYK-colours of the four different toilets, it gives you a clear recommendation on the cleanest toilet.
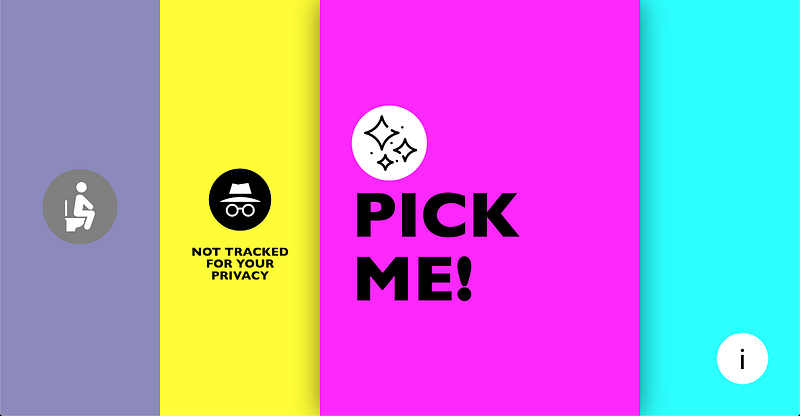
From left to right:
- Icon showing the Key (black) toilet is occupied.
- Our Yellow toilet is currently marked as “incognito mode’, meaning we don’t measure visits neither do we recommend this loo.
- The Magenta toilet is the best pick at this moment.
- Cyan is available, but not the current recommendation.
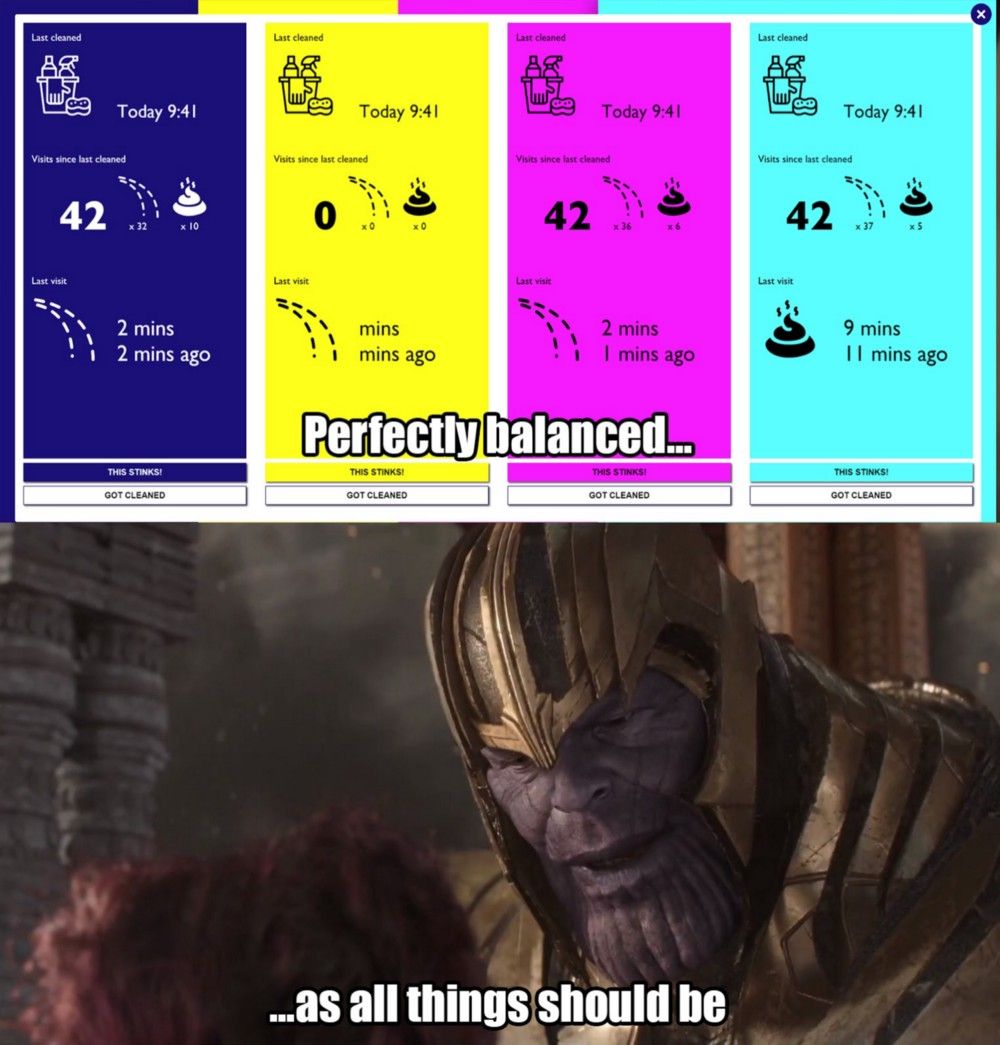
Pressing “i” provides more information about each toilet (see below).
We implemented the incognito mode due to privacy reasons. Although the data is anonymous, and you won’t be called into our CEO’s office for your stats (as someone on Twitter feared) we still wanted to offer this option for Q-ers and guests who might be uncomfortable about having their loo visit tracked. Interestingly, since the incognito loo never shows up as recommended, nobody uses it. All toilet goers meekly chose one of the other recommended toilets. This shows how well our Shitty Load Balancer works!
Several months later
At first we were expecting some push-back, since toilet visits are a rather taboo subject. But in the end everybody likes what we built. We got a lot of positive feedback from colleagues and office visitors alike. Based on our data we can see that everybody follows our advice. And most days we even see a perfectly load-balanced result!
Always wanted to work for a company where you can build connected toilets on a free afternoon? Check our job vacancies (in Dutch) at https://werkenbij.q42.nl!