Creating a next-level web experience
My journey of turning a visually stunning concept into an animated memorial monument in just two weeks


At Q42 we work for a lot of clients on a broad range of different projects. One of those projects was to build an online monument for the National Remembrance 15 August 1945. The idea of this website is to complement the physical Indies Monument in The Hague. As you can imagine, the average informational website was not going to suffice in creating a monumental experience of commemoration. How do you translate the monument feeling into an experience on the web?
Together with design agency Fabrique we came up with a concept around the Melati, the indies jasmine. In this concept, the Melati serves as a symbolic version of the monument populated by personal thoughts, memories and stories. By combining the many Melati's with historical images and film material, the website grows into a living monument. A monument that does not appear heavy and stately, but light and lively.

The corresponding design posed several goals and challenges:
- Create the experience that there is a lot of content to explore.
- Create the experience that this content is part of an organic whole.
- Make it performant by a trade-off between data quantity and choosing the right technology.
- Ensure the experience is tailored to the device that the user is on.
- Provide a suitable interaction with the content of the experience.
On top of these challenges we also had the constraint to research, build and finish this vital part of the website in just two weeks. 😅 How do you go from a very innovative and challenging concept and design to a functional experience with various constraints?
In this post, I will walk you through my journey of building something I didn’t know I could do by experimentation and making pragmatic choices. I hope to inspire you that you can do the same.
Choosing the right technology for the job
The concept created by our friends at Fabrique was innovative, exciting and definitely not your average web interface. The fact that it was visually quite abstract and consisted of hundreds of flat circles led me to try out HTML5 canvas at first. I briefly considered if this would be possible with an SVG animation. But I quickly reminded myself that continuously animating more than a few dozen HTML DOM elements was not going to perform at all. So I discarded the idea of using SVG, and started working out a first proof-of-concept using HTML5 canvas.
HTML5 canvas from scratch
My first attempt was to build a ring consisting of a few hundred tiny circles. with HTML5 canvas from scratch, without the use of any library or framework. To me this always seems like a good place to start, as frameworks often result in quite some additional JavaScript load and unnecessary functionality. This isn’t always worth it. I did find out, however, that the canvas API is actually quite low level. Creating shapes and making them move with `requestAnimationFrame` is possible, however not as easy as with plain old HTML and CSS. Interaction and performance was a different story. Researching on how to both add mouse event listeners on the canvas elements and making it performant for hundreds of those elements at the same time, quickly led me to consider a framework anyway. While I’m sure I could have re-invented several canvas optimization strategies eventually, I figured it was too time consuming and definitely not within scope. No worries though, I had another lead to go on: Konva.
Konva.js
So what is Konva and why did it seem like a better idea than my previous approach?
Konva is an HTML5 Canvas JavaScript framework that extends the 2d context by enabling canvas interactivity for desktop and mobile applications.
Right, so an extension around the low-level 2d canvas context API with interactivity. Sounds exactly like something we need! The extension takes care of click events and performance, and exposes a more high-level API to allow us to focus on building awesome user interaction and spend less time reinventing the wheel. Konva also offers quite some extensive performance optimisation and guidelines. An example in the documentation shows 10,000 interactive shapes with tooltips.
While the simple interaction with static shapes in the example works beautifully, it did not so much for animated shapes with more complex interactions. For example, we wanted the target shape to animate in size on hover. I tried to apply most of the performance guidelines of the framework, but I simply couldn’t get my basic version to work at a solid framerate. Konva was not going to cut it, I needed something more powerful.
In my search I came across WebGL several times. WebGL is basically canvas on steroids. It is much more low level and therefore more efficient in giving the GPU performant instructions to make cool stuff happen on the screen. So the logical next step was to dive into WebGL.
(By the way, WebGL is a technique we use more often in our web projects. If you are interested in a true deep dive into WebGL, check out this blog post by Q-er Marcel: https://engineering.q42.nl/webassembly.)
WebGL and PixiJS
WebGL by itself is even more low level than HTML5 canvas, so I started searching for a suitable library or framework. PixiJS is a 2D WebGL framework to create beautiful digital content. I worked out the same proof-of-concept as I did with Konva and it worked like a charm. The framework offers a great, intuitive high-level API with all the performance advantages of WebGL. It also provided future proof functionality like post-processing options, accessibility support and other goodness to create an even more engaging experience.
While it was the most powerful option, it was also the heaviest and largest in terms of bundle size. In my opinion this was worth it, as the canvas visualization was going to be the core of the concept. The experience and feel of the animated flower was going to be the most important goal. So having a tool that allowed us to get there in time was definitely a reason to get started with PixiJS.
Technical challenges
While building the interactive canvas there were quite some technical challenges, of which the three most important ones are explained below.
🇳🇱 👋 Hey Dutchies!
Even tussendoor... we zoeken nieuwe Q'ers!
Recreating the Melati in code
One of the challenges was to get the flower illustration on the WebGL canvas. My first thought as a WebGL rookie was: alright let’s export the asset created by the designers from Sketch as an SVG and load it in. Turns out, it’s not that easy. Firstly, an SVG doesn’t exist in the world of WebGL, because it rasterizes images. That was going to be a problem, as I wanted the illustration to look crispy for both small mobile devices as large retina displays. Secondly, an SVG also does not offer much control. And I needed a lot of control. As you can see in the image above, the circle shapes needed to be evenly spawned within the leaves of the flower. For this reason I had to make the shape in code. The flower in the most basic sense boiled down to curves, and for drawing these curves I needed a bunch of math.
Let me start by mentioning that I’m not a mathematician. Quite the contrary. To get started on this, I needed a basic math refresher. Shout-out to The Coding Train, a YouTube channel that introduced me to the world of processing and using math to create visual art for beginners like me. I wish he was my math teacher back in high school. It would have been so much more motivating and practical. Anyway, I’m sidetracking.
After some research I found out that the math I needed to draw curves that would make up the flower were quadratic (1 control point) and bezier curves (2 control points). You might know bezier curves from CSS transition timings like `ease-out`. They are among other things useful to create smooth looking animations. In this case however, I could use them to create one of the leaves of the flower. After some trial and error, I eventually created three vectors containing the coordinates for the curve control points. With the appropriate curve values, it turned out to be a well enough representation of the flower.
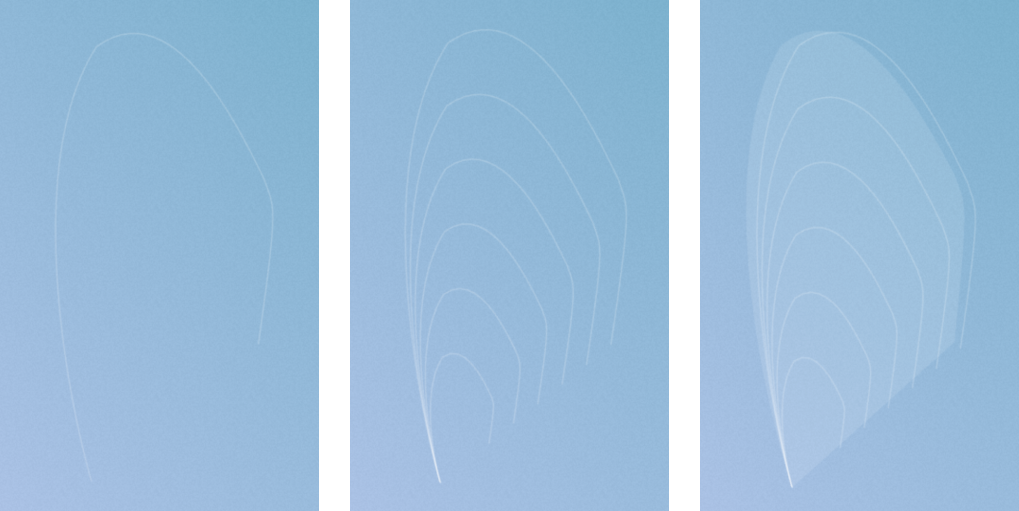
However, a single line would not give us the effect we were looking for. So, using a few loops and a scale variable I created several smaller versions of the same line to get closer to the designed result. To top the leaf off it only needed a subtle background. Again I could use the existing render logic for the shape here and add a transparent white fill color instead of a stroke.

While it would be awesome to create the entire flower with a single, mathematical formula, I simply didn’t have the skills and time for it. What I did instead was simply loop over the amount of leaves and rendered them with an angle offset to form the flower. There we go, I created a flower! This might not be the best solution, but it was pragmatic, understandable code and it offered me a lot of control for distributing the data points within the leaves.
Distributing the points within the leaves
Another challenge was to distribute personal stories and articles as points on the canvas illustration evenly. It had to create the feeling of there being a lot of content, without having to load in too much data. I figured I was going to start with a total number of 150 points to display. An even distribution in this case means placing an equal amount of points in each leaf of the flower.
Alright, so I want 150 / 6 = 25 points in each leaf. Looping over the leaves and calculating the amount per leaf was easy. The fun part was in making sure to position them on top of the leaf. After searching for how to spawn points within a polygon I found out that getting a random vector coordinate within a triangle is surprisingly feasible. On top of that I already based my leaves around four vector points, in other words a polygon shape consisting of two triangles.
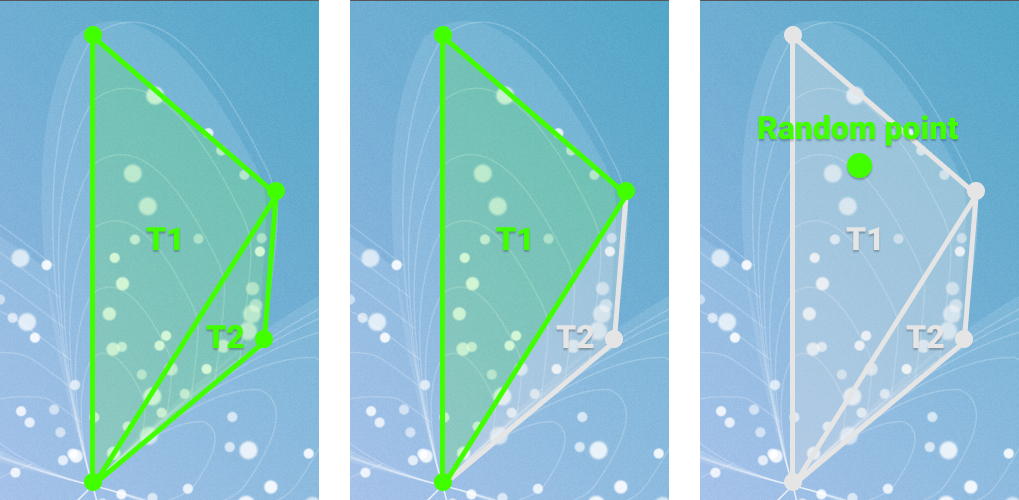
I created a triangle class containing three vectors and added a helper function based on a very helpful blogpost about finding random points in a polygon that would return a vector based on this triangle. I then use a leaf class to create two triangle instances, choose one randomly and get a vector point within it to randomly return a point within the leaf. Of course I could have taken this even further to also spread them within the triangles evenly instead of randomly. But as discussed earlier, time was of the essence. Besides, the profit would be marginal, as the result was already great.
Animation and experience
On top of displaying the flower and populating it with evenly distributed points, we challenged ourselves to make it look organic and ‘alive’. Let me shed some light on the technicalities. For this I used both math in the update loop of the PixiJS instance and GSAP for additional tweening. GSAP is a JavaScript animation library with an especially powerful tweening API. The rationale behind leveraging a library for this is that we not only required organic animations for this single feature, but throughout the entire site. Again, this choice makes sense and was worth it for this specific project because animation took the lead in most of the features. On top of that CSS wasn’t going to cut it and involving JavaScript was definitely required.
One of the ideas was to start with an empty flower and let some of the points fly in from the edge of the viewport. The first step was to decide the spawn point of the bottom-left corner of the viewport.
Using the current window inner width and height and an additional offset I had a starting point. Then using the tween plugin of GSAP TweenMax’ motion path I was able to create a curve to tween from the calculated spawn points in the bottom-left corner to the target point within a specific leaf in the flower, like so:
TweenMax.to(this.graphics.position, duration, {
  motionPath: [
    { x: this.spawnPos.x, y: this.spawnPos.y },
    { x: this.targetPos.x - 250, y: Math.min(innerHeight, this.targetPos.y + innerHeight / 4) },
    { x: this.targetPos.x, y: this.targetPos.y }
  ],
  ease: Power4.easeOut
});
To top it off, I made sure to take around 20 points spread around the entire leaf and sequentially animate them in with a small stagger to create a circling effect. After that I faded in the rest of the points in order as well to complete the animation.
The final step was to add an idle animation for the points to maintain the organic feel of the monument. The idea was to subtly rotate the points around their own axis.
As learned in my math refresher, I could achieve this with cosine for the x position and sine for the y position. You might be thinking: “Cosine and sine, I vaguely remember those from my math lessons...”. I thought the same and it’s not as bad as it sounds. The theory behind it is much more extensive than I’ll ever learn, but all I needed to know was that they can be used to respectively calculate the X and Y coordinates of a circle. Add the current time to that and we can rotate around our own axis smoothly. Voila, an idle animation! To top it off I added a few modifiers like a velocity to easily control the animation speed and ‘feel’, resulting in the following code that executes every tick.
public onTick(delta: number) {
  this.time += delta;

  for (let i = 0; i < this.points.length; i++) {
    if (point.spawned) {
      const x = point.graphics.x + point.velocity * Math.cos((point.direction * (this.time + point.offset)));
      const y = point.graphics.y + point.velocity * Math.sin((point.direction * (this.time + point.offset)));
      const pos = new Vector(x, y);

      point.update(pos);
    }
  }
}
By updating the actual point positions with the right values it creates the following subtle animation:
Learnings
To conclude my journey, I would like to go over what I, and hopefully you, learned from this. When you are presented with a visually stunning, challenging concept and are supposed to build it in a very short time frame, it is key to take things one step at a time. Take enough time to carefully consider the technology, because having a solid foundation definitely benefits the project later on. At the same time don’t worry about using something that might not be the answer to life, the universe and everything, but does the job well enough for your specific use case given the constraints that you have.
Also don’t be scared to tackle challenges that you think are out of your reach because they for example rely on math that you don’t know. My experience here and what this post is trying to illustrate is that even without that knowledge, breaking things down in small bits really helps to isolate the core challenge. Those tiny chunks are much easier to research and find solutions for.
The next time I see a design or concept like this I’m confident that, even though I don’t know how to build it at the start, I will learn how to build it along the way. I know you will too!
Do you also like technical challenges? Check our job vacancies (in Dutch) at werkenbij.q42.nl!