A deep dive into improving indoor localisation
My research journey into the usage of fingerprinting in combination with K-Nearest Neighbor to improve the indoor localisation performance of the Rijksmuseum app

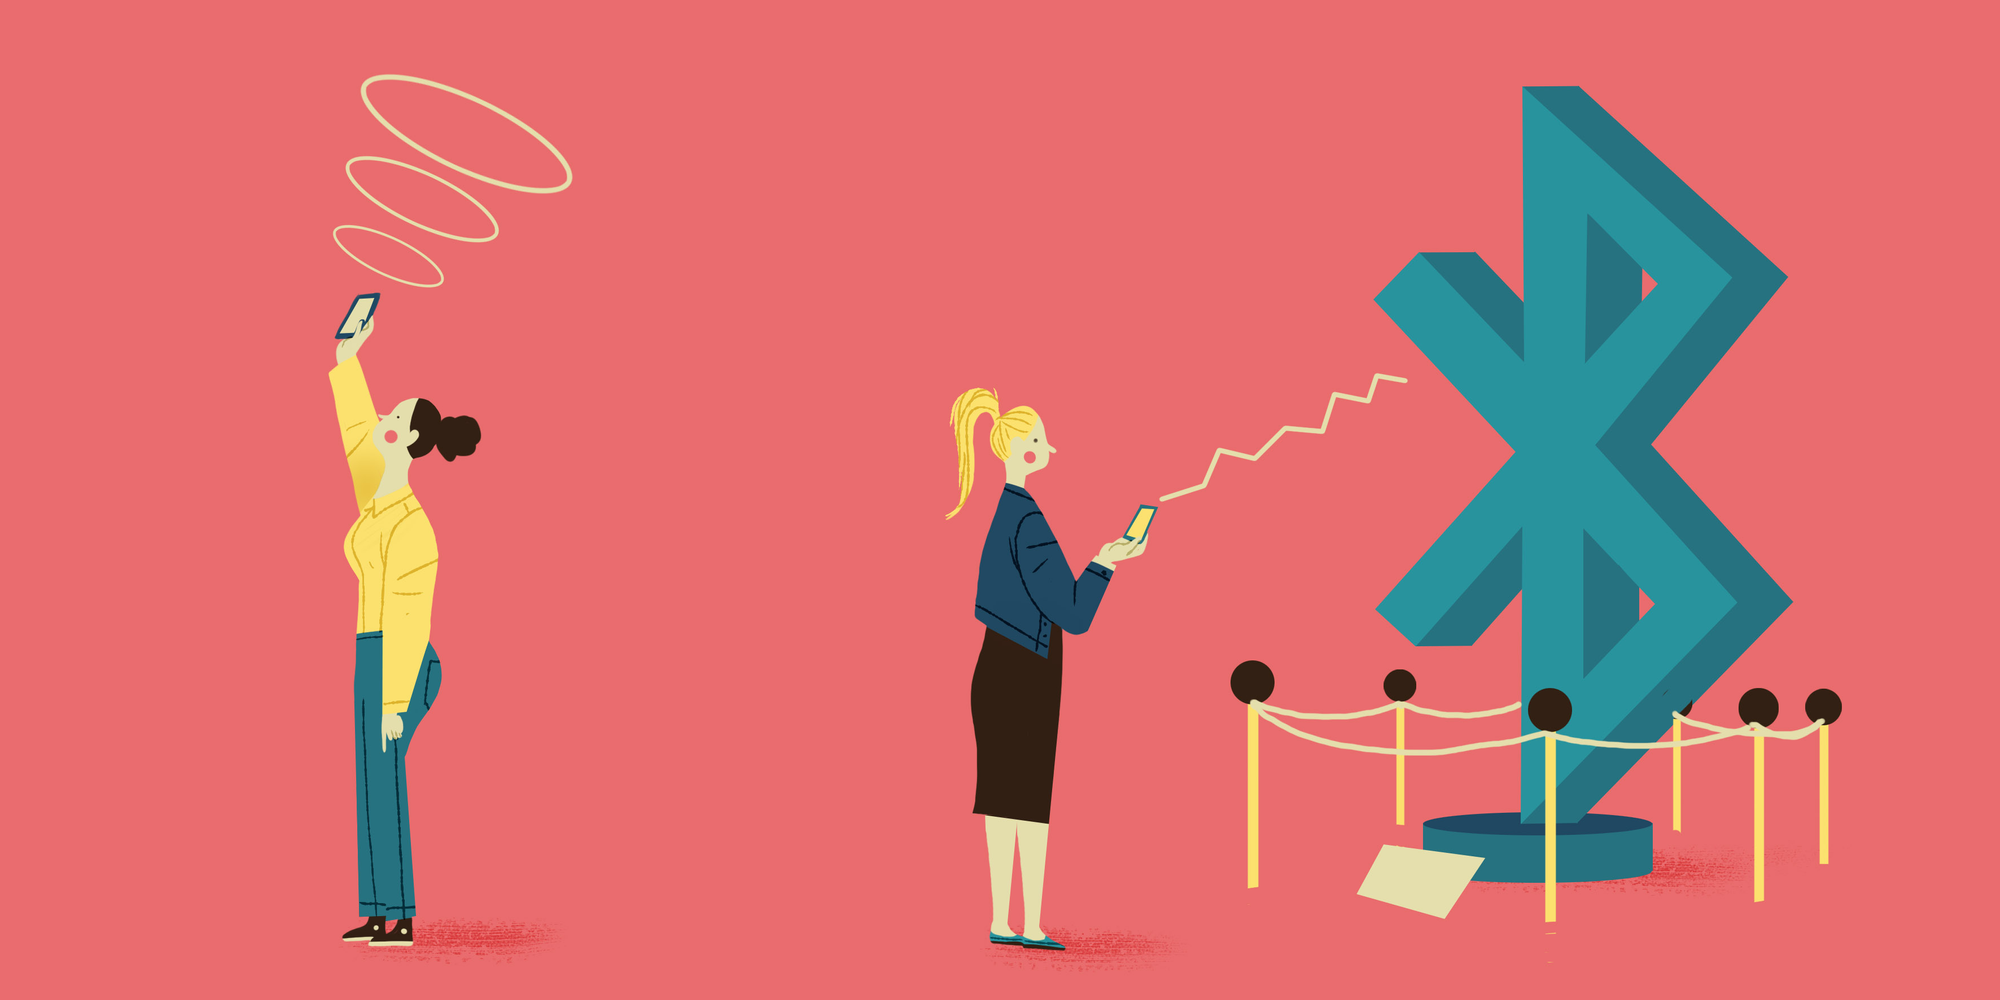
At Q42 we develop the Rijksmuseum app. One of the goals of the app is to offer alternative ways to explore the museum, different from the physical signage. In order to offer these routing alternatives, accurate indoor localisation is key. Because GPS is inaccurate indoors, we need another way to determine the location of users. This is where Bluetooth beacons come into play.
Bluetooth beacons are small devices that transmit Bluetooth signals. The signals include an Universally Unique Identifier (UUID), a Major and a Minor, used to distinguish between networks, floors and single beacons respectively. A receiver can read this information together with the strength of the signal, referred to as the Received Signal Strength Indicator (RSSI). By combining this information with the known positions of the beacons, a location can be determined. The room connected to the beacon from which the strongest signal is received, determines your location.
This approach, as implemented in the Rijksmuseum has its flaws. Such as rapid position switching if near an entrance and random teleportations to different floors. I wanted to find out if these problems can be solved for multiple devices and if I can localize more precisely than per room. So, I started investigating the possibilities within the indoor localisation research field.
Jump on board and experience the complicated ride, or check out the conclusions straight away.

Why just installing beacons is not always sufficient
So, the current system is based on one simple principle: the beacon from which the strongest signal is received, determines in which room you are located.
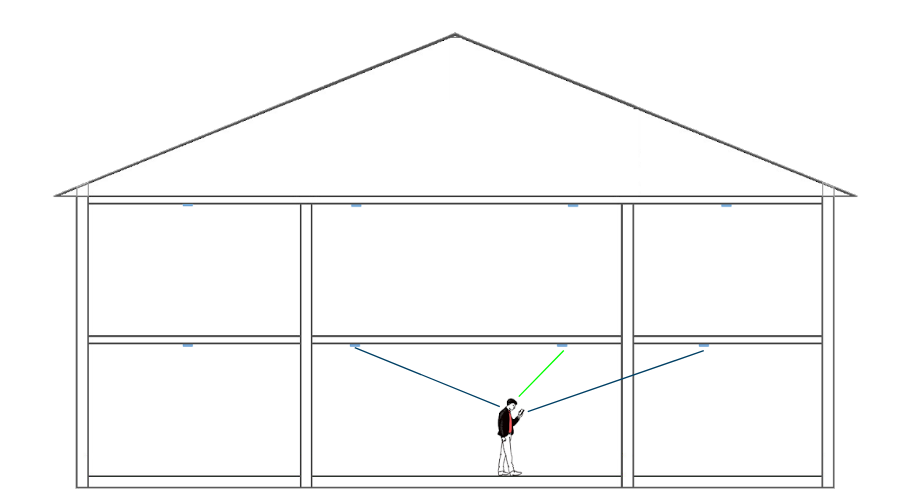
However, this approach has several limitations. Firstly, with respect to Bluetooth signals, fluctuations of the RSSI makes location estimation inaccurate. The signals are influenced by almost anything: used construction materials between different rooms and floors, WiFi (since it operates on the same frequency as Bluetooth), human bodies and the effect of being reflected. Furthermore, environmental changes, like the density of people, positioning of furniture and multipath propagation (receiving the same signal several times because it has traversed different path lengths). In general, the further you are away from the beacon, the more the signals are affected by interference and therefore the less reliable these signals are.
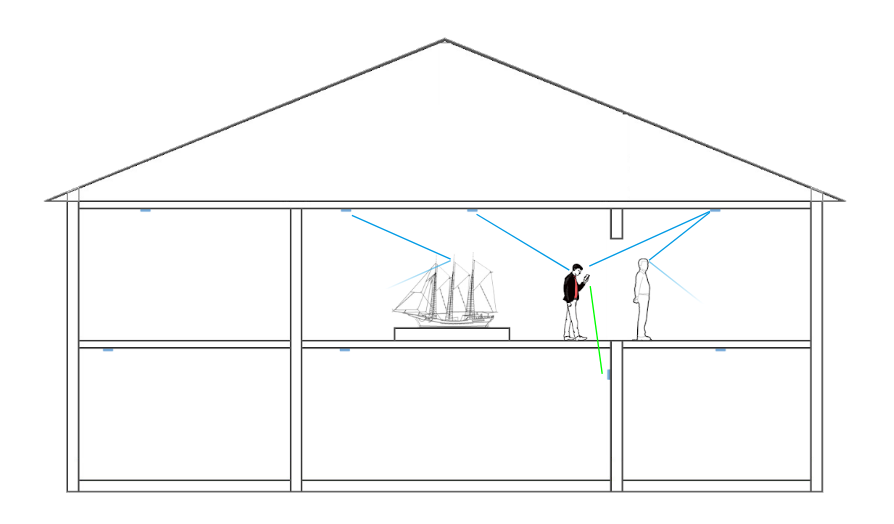
Secondly, according to the Rijksmuseum, it is important that there is no distraction from the art objects on display, which means that the Bluetooth beacons should not be visible to the public. As a result: beacons are installed under a floor or on top of lamps, and more randomly scattered throughout the museum. Ideally, the beacons would be positioned in an equally spaced grid, without being obstructed by surrounded objects. The lack of optimal placement in the Rijksmuseum makes it a greater challenge.
Thirdly, regarding visitors, smartphones of different brands and types each have distinctive sensors, which means that one phone can receive fewer or weaker signals than others at certain locations.
The challenge of increasing the indoor localisation accuracy
What do you think could be a solution? Maybe installing more beacons? But, this would be a costly decision and we would still be limited by the positioning. Maybe use multiple beacons to determine the position instead of just the nearest one? But each beacon is connected to a single room, how are we going to combine that?
This imposes a challenge. Can we squeeze more precision out of the current setup? Is there a way?
The indoor localisation research field is broad. There are many techniques and implementations possible for different situations. I explored the field and analysed the possible approaches.
Instead of increasing the amount of beacons, I could also choose to increase the amount of reference points. A reference point is a predetermined location mapped with the RSSI of surrounded beacons. This reference point is also called a fingerprint. A collection of those reference points form a database, the fingerprint database.
Fingerprinting is one of the three main directions in indoor localisation. Other approaches are proximity, where localisation is based on the location of the broadcaster from the strongest signal (this is the current approach). And, trilateration, where localisation is based on the intersection of distances between the receiver and multiple beacons.
While trilateration is more time efficient than fingerprinting, because creating a reference database takes a lot of time, one of the disadvantages of a trilateration approach is the problem of converting the RSSI signals into distances. There is a non-linear relationship between distance and RSSI, because the RSSI is expressed in decibel-milliwatts (dBm), which is a non-linear metric itself. For example, the difference between a RSSI value of -40 and -41 is smaller than the difference between -70 and -71. The non-linearity makes the readable range of signal strength narrow. Moreover, the variables of the model used to calculate the distance needs to be adjusted for every beacon, especially in the Rijksmuseum where beacons are hidden away behind different materials, each with their own effect on the RSSI and possibly the distance model.
Creating a fingerprint database
Although it is a manual and time-consuming task, I think the fingerprinting approach is the most suitable. So, how did I get it done?
The first thing you need to know is that there is a caveat: you need a good indoor localisation system in order to create a good indoor localisation system, a kind of chicken and egg problem. A windfall of the Rijksmuseum, is that it is symmetrical. This symmetrical feature made it easier for me to guess and capture an indoor location without introducing too much inaccuracy.
For the data collection I’ve built two mobile apps. The first app ran on one phone only, and was used to place markers on a scaled map of the Rijksmuseum. This scaled map is freely available in Google Maps, making an implementation much easier. The positions of the markers are expressed in latitude, longitude and floor and stored together with a timestamp. The color of a marker indicates a time of recording. After a predetermined time of ten seconds, the red marker turns green to indicate that you can move to the next position. Multiple seconds of data are recorded per location, to make sure that signals are received and that there is an opportunity to filter signals. More about that later.
The second app I built ran on multiple phones and had the purpose to record Bluetooth signals. The received information like the UUID, Major and Minor were stored together with the RSSI and timestamp. To test how well the approach would work for different devices, multiple phones have been used. Namely, an iPhone 6S, Samsung Galaxy S5 Mini, Moto G5 and an Imagineear (standard tour device of Rijksmuseum).
The Android devices report the RSSI of nearby beacons once every 0-3 seconds. iOS is more consistent, with once every second.
During the data collection it was important to create multiple separate datasets. A training, test and validation set. The training set is used for creation of the fingerprint database, the validation set is used to tweak parameters and the test set to determine the final performance. Different from training, is that for test and validation three seconds of data is recorded per location instead of ten. The smaller timespan simulates a more natural movement through the museum without too high of a chance of not measuring signals at a certain position.

I walked around with an old-fashioned belly bag full of devices, holding a phone and placing markers with a touch pen. After many hours of data collecting I was ready for the next step: The offline phase, constructing the fingerprint database.

In order to create the fingerprint database, both the location and signal strength data had to be combined based on the timestamp. This resulted in the data format as depicted in Figure 5. Then, all the signals at a single location had to be converted to a single row.
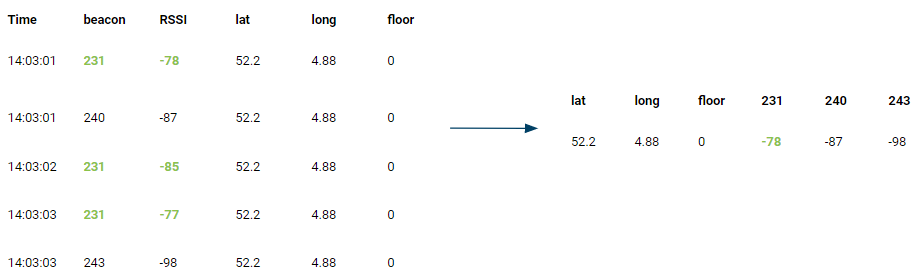
When a beacon has multiple signals these have to be combined. I decided to use the Median. Figure 6, visualises how the RSSI values of beacon 231 are combined and structured together with the other beacons and the real location. Beacons that are not in range get a value 1000. Doing this for all the recorded locations, creates the fingerprint database.
Estimating a position using new incoming signals
Hold your horses, because now we are getting into the real stuff! How are we going to use new incoming signals and the fingerprint database to estimate your location? Well, first things first, we aggregate new signals to one second intervals using the median.
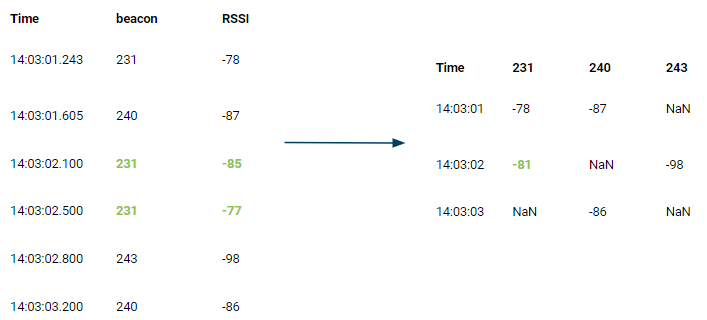
For the next step a filter is applied to combine multiple measurements. This reduces rapid fluctuations in signal strength caused by interference and makes the measurements more reliable. The world of filters is endless. One could choose probabilistic filters like Bayesian or Kalman or use deterministic filters like median or mean. In this example a mean filter with a window size of three is used.

Now, we have our measurement ready to use. But what to do next? How am I going to use the measurement together with the fingerprint database to determine the location? The answer: k-Nearest Neighbor. Like the name suggests, I use the k fingerprints that are the closest related to the measurement to determine the location. If I use a k of one, the location coupled to the nearest fingerprint is the estimation. If I set k to a higher value, the average of the k locations is the estimated position.
But, there is a problem, what if we use a k of three, and we find that for a certain location two fingerprints are close, but the distance to the third turns out to be way further? In that case you don’t want the third fingerprint to heavily influence the estimated position, since we know, the greater distance the less reliable the signals. Solution: we incorporate a weight. The goal of the weight is to give the closest fingerprints a larger share in the final prediction, than those that are further away. The weight Wi and estimated position P is calculated as follows:
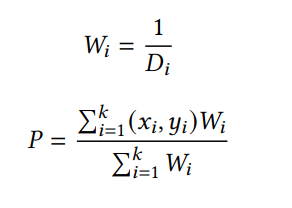
Wi calculates the weight, where i represents the index in the list of the k nearest fingerprints and Di the distance between measurement and fingerprint i. P is the sum of the weights time latitude xi and longitude yi of the k closest fingerprints, divided by the sum of the weights. (For more information check the paper from Kriz et al.)
I'm afraid I already lost some of you, but no worries, I will provide an example in the next section to make this more comprehensible.
At this point, there is one problem remaining, how should I determine the floor?
For this I used a majority vote of the k closest fingerprints. Because the k will always be an odd number, there will never be a tie.
Inferring the estimated position
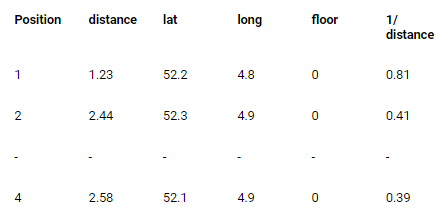
To start off, the distance between the measurement (right table in Figure 8) and all the fingerprints has to be calculated. The Euclidean distance is the most commonly used, but there are many other distance formulas. Research shows that Neyman, Manhattan and Sørensen distance perform well for calculating the difference between RSSI values for indoor localisation (check the work from Torres-Sospreda et al., for a more detailed explanation).
After the distance has been calculated between the measurement and every fingerprint, the database is sorted ascendingly on distance and a majority vote is carried out to estimate the floor (Fig 9). For this example I used a k of three.
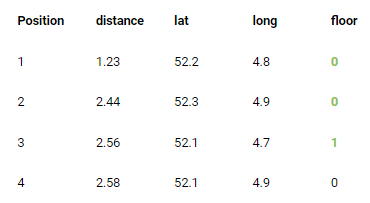
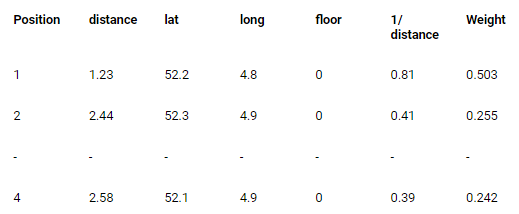
Next, the database is filtered to only contain the fingerprints from the estimated floor and the weight of each fingerprint is calculated in two steps. These steps are depicted in Figure 10 and 11.
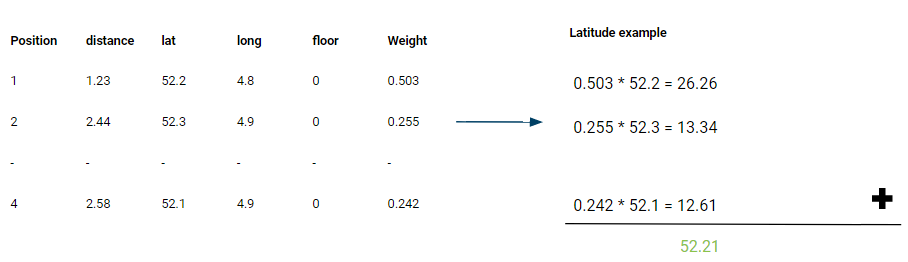
Finally, to calculate the estimated position, for each fingerprint the weight is multiplied with the latitude and longitude. The estimated location is the sum of the result, as shown in Figure 12. This results in an estimated position of (52.21, 4.85, 0).
Using different data representations
In the example above, I used an unaltered data representation. It is possible to use different data representations such as exponential and powed. The reason to do so is because it better reflects the non-linear scale of which RSSI is measured (decibel-milliwatts) as mentioned before.
Conversion of the data showed to have benefits in previous research. Therefore I included it as an extra parameter to look into (see Torres-Sospreda et al.).
🇳🇱 👋 Hey Dutchies!
Even tussendoor... we zoeken nieuwe Q'ers!
Determining the best solution
I know what the problem is, I know a way to approach the problem, but how am I going to determine what works best in the current situation? I can use different filters and window sizes, different distance metrics and data representations and different values of k. Moreover, I do not use just one, but four different devices. Testing every possibility would take too much time, so I needed a way to reduce the amount. I decided to divide the approach in three steps. From each step a selection of the best performing models is taken to the next step. All steps are executed on the validation set.

The performance of a model is evaluated by a combination of the floor and position estimation error using the following formula:
Error = (4 * Floor error) + mean absolute error
Here, the floor error is a proportion of the positions where the floor was incorrectly predicted. The 4, is a correction factor in meters. The mean absolute error is the average distance between the estimated position and real position. For example, if a model predicts 90% of the floors correctly with a mean absolute error of 5 meters, the Error would be (4 * 0.1) + 5 = 5.4. The lower the Error, the better the model.
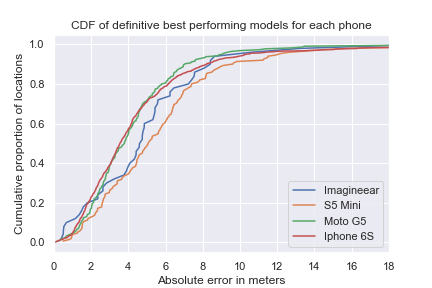
Figure 14, shows the results on the validation set after all the steps have been completed.
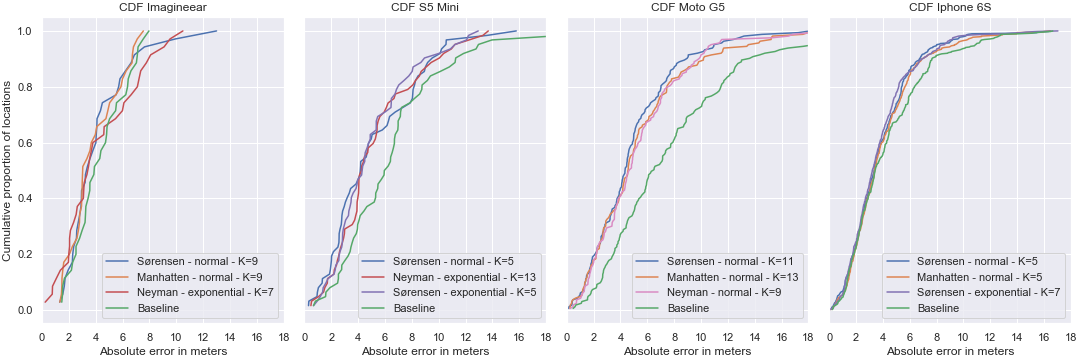
The graph exists of four subgraphs, one for each device. For each device the three best performing models together with the baseline are plotted. The baseline uses no filter, a k of three, the Euclidean distance and a normal (or unaltered) data representation. The x-axis is the absolute error (between the estimated and real location) in meters, the y-axis shows the proportion of the total locations tested. So for example using the Imagineear (first subgraph), 20% (0.2) of the tested values have an absolute error of around 2 meters. The steeper and more left sided the line, the better the model performed. The graph shows that all devices perform well using Sørensen distance and either a normal or exponential data representation with a k between 5 and 11.
The same models have been tested against the test set in addition with a general model, which uses a mean filter with a window size of three, a normal data representation and Sørensen distance (Figure 15). This is to make sure that the results are not accidental, and therefore generalisable.
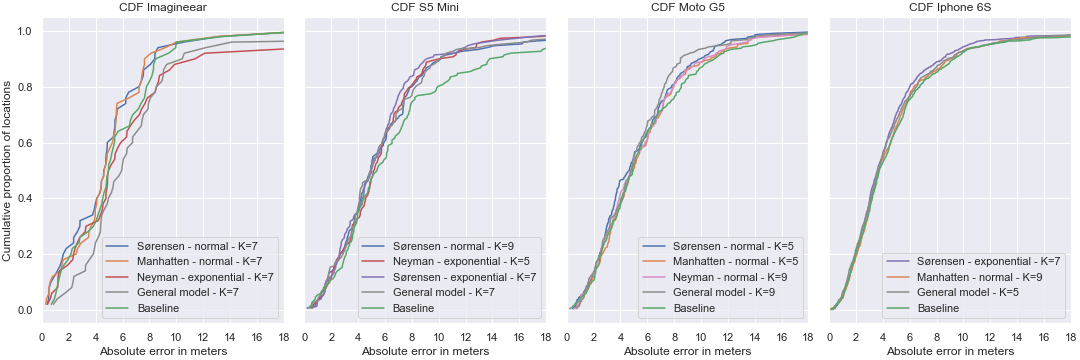
Remarkably, the absolute error in all subgraphs grows significantly in the last 20% (0.8 - 1 region). But why is this the case? Let’s take a look at the locations where the absolute error is bigger than 8 meters.
Important to add, based on the graph above you cannot say that for example the iPhone 6S has more locations where the absolute error is bigger than 8 meters than the other devices. The devices recorded a different amount of test locations, which means we should look at a percentage.
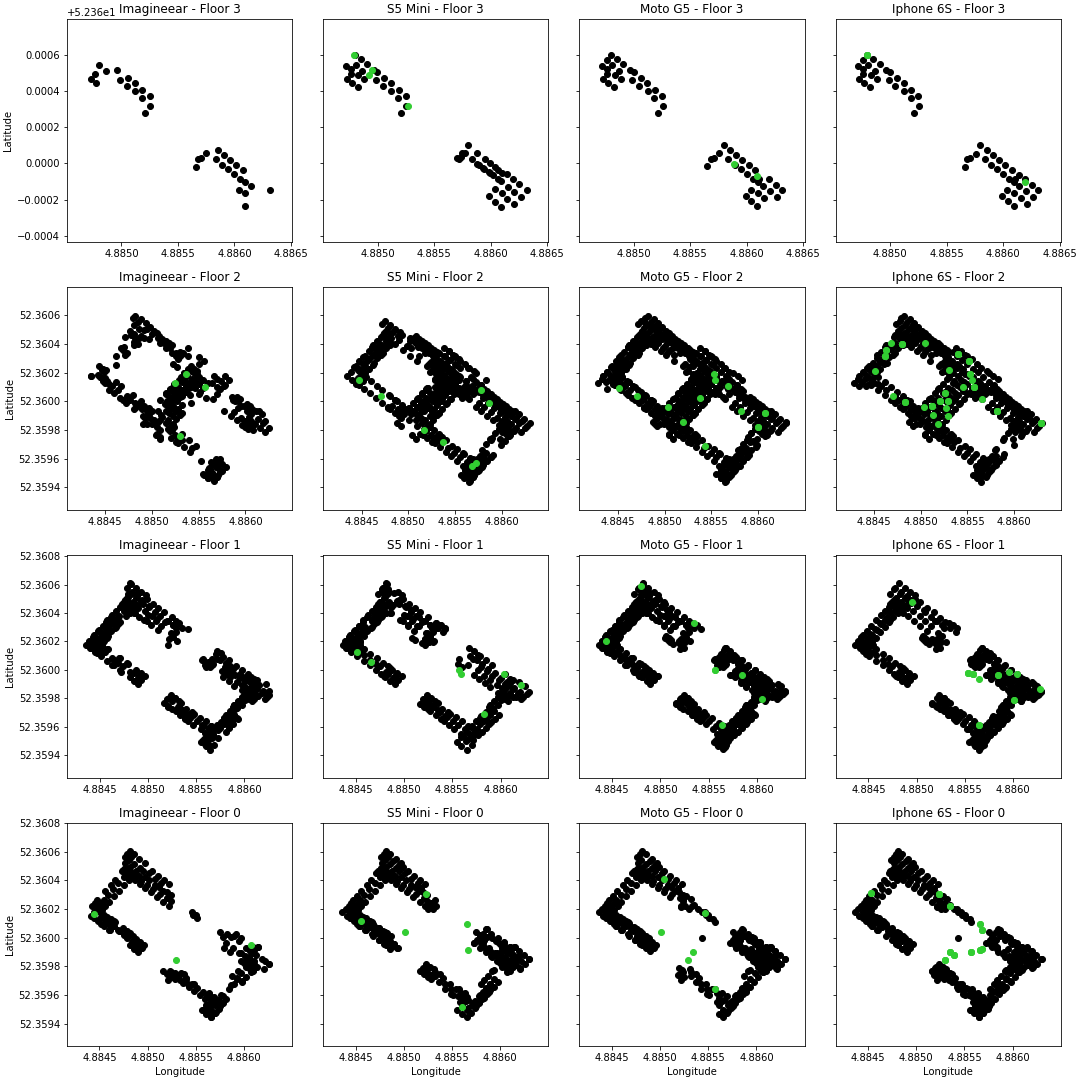
In Figure 16, the black dots are the fingerprints and the green dots are the real locations of the estimated positions. Each column is a device, each row represents a floor. Based on the graph, two things stand out. First, many green dots on the ground floor for example are not surrounded by black dots, indicating that there are no fingerprints recorded at those locations. Second, on the second floor of the iPhone 6S many green dots are clustered in the middle area or 'Eregalerij'. After some research, it turns out it may partially be caused by the lack of beacons or beacons with empty batteries in this area.
I've executed the same analysis on the wrongly predicted floors. It turns out that the Moto G5 has trouble in one of the lower right areas. This is caused by an imbalance in the data, where the first floor has more fingerprints than the ground floor, creating an imbalance during the majority vote.
More parameter tweaking
The results on the test set and the error analysis, lead to two extra questions. What happens if I use a different amount of k for predicting the floor and predicting the location? And, is it possible to use a single fingerprint database for all devices?
It turns out that only the Imagineear tour device benefits from using two different k values, with a very small decrease in the error. The performance of devices on other fingerprint databases is visualised in the following graph:
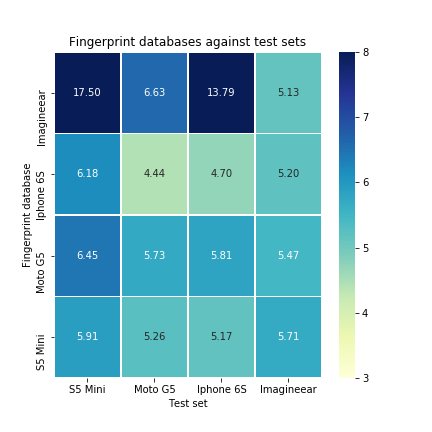
All devices perform well on the iPhone 6S fingerprint database, at the costs of a small error increase in comparison with their own fingerprint database. Striking is that the Moto G5 performs a lot better than on its own fingerprint database.
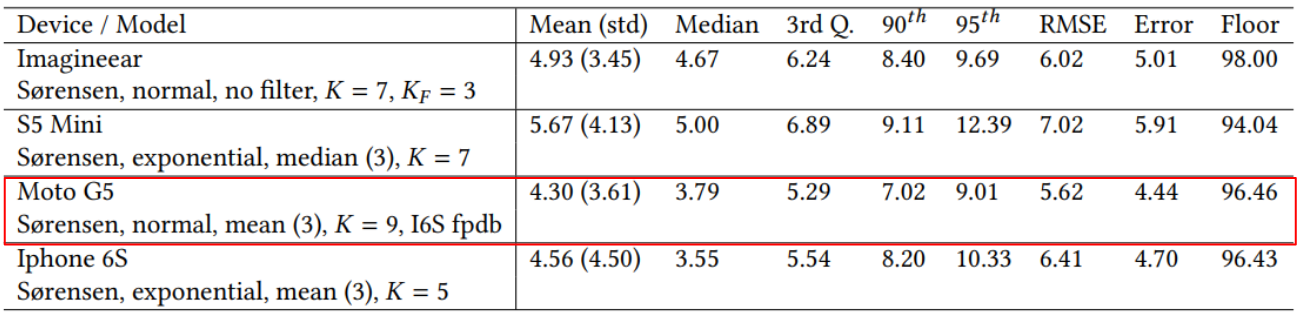
After all the tweaking and tuning, the final result is that there is quite a difference between the performance of the devices. S5 Mini performs way less than the other devices. The Moto G5 scored best with a mean absolute error of 4.30 meters and a floor prediction rate of 96.46%.
Limitations: a first step
There are some limitations from my research. During collection of the data the phones were stacked on each other inside of a belly bag. The phones may influence each other and therefore the performance. Besides, the devices were held on belly height, while people usually hold them much higher. Another limitation is guessing the indoor location, although you can be fairly accurate due to the symmetrical properties of the building, this leaves room for mistakes. Regarding filters, I tested only deterministic filters as opposed to probabilistic filters, these might improve the performance as well.
Finally, the performance of the system is only measured with data. Whether the system actually performs better does not only depend on performance, but also on the user experience, real-time performance and efficiency.
Conclusion: a real app
This research is a first step in exploring the improvement of the localisation performance at the Rijksmuseum.
The Weighted K-Nearest Neighbor fingerprinting approach can predict the location more precisely than the existing room-based solution. After testing many setups and possibilities it turned out that Sørensen distance performed well on all devices with either a mean or median filter and window size of 3. The k value is best to be set between 3 and 9 and it is possible to use a single fingerprint database for all devices at the cost of a small error increase. Changing the data representation to exponential does have a positive effect for two of the four devices, but is not a guaranteed improvement.
Phew, that was quite the ride! The next stop will be implementing the system into an app prototype and explore the real world performance.
Takeaways
- Like many data science practices, good data is key. The better the fingerprint data, the better you can expect your system to perform.
- Don't always stick to a common approach like using the Euclidean distance. Explore other possibilities and test if you can get a performance gain.
- The world of indoor localisation is complex and does not have a one-size-fit-all solution. Each building, beacon network and device has its differences. Different environments may require different approaches.
Want to get more detailed information about this approach? Send me an email!
Do you also love improving existing solutions? Then you might like our happy place for nerds. Check our job vacancies (in Dutch) at https://werkenbij.q42.nl!